
Welcome back to iLeads Mortgage Market Minute, where we bring you the latest, most relevant news regarding the mortgage market. We hope you enjoyed last week’s edition where we talked about The Housing Market Is Hot, But Not In A Bubble. This week we’re bringing you:The Downside Of The Hot 2020 Housing Market: Rapid Home- Price Growth
Mortgage Rates Surprisingly Steady Despite Market Drama*
Like many industries, housing finance has a superficial layer that’s fairly easy to understand for the average consumer. A person wants a home. They don’t want to pay cash. They get a loan. Lower rates = lower payments. The end.
Shortly below that superficial layer of understanding, where a surprisingly high percentage of mortgage professionals operate, it’s popular to discuss 10yr Treasury yields as a basis for mortgage rates. The only problem with viewing 10yr yields as the basis for mortgage rates is that they’re not.
Anyone can observe this objective fact by jumping just a bit deeper into the rabbit hole and acquainting themselves with MBS (mortgage-backed securities). These are the true raw ingredients for mortgage rates even though they frequently mimic 10yr Treasury yield movement.
By the time someone has reached this level of understanding, there’s not much left to do when it comes to keeping an eye on mortgage rates. People who know about and track MBS have truly arrived! They’re the coolest mortgage rate watchers you know!
But wouldn’t you know it, they have some head-scratching to do in 2020, and especially today. MBS got demolished today. Normally when that happens, you can bet that mortgage rates will be noticeably higher. Today, however, they’re not.
Why?
Suburbs see greatest gain in single-family construction in Q3*
Second-home markets are also seeing growth during the pandemic
The National Association of Home Builders‘ Home Building Geography Index found that during the third quarter, the exodus from big cities to the suburbs and less expensive areas increased as people continue to work remotely.
According to the HBGI, suburbs of medium-sized cities posted the greatest single-family gains in Q3, as there was a 15% growth rate over the last four quarters. The worst-performing regions were large metro urban cores, with a 5.7% gain.
Since Q1, the market share for single-family construction in urban core areas fell from 18% to 17.2%, the report said. However, small metro core and suburban single-family market share increased from 37.7% to 38.2%.
The report showed that single-family construction in second-home markets expanded at a 13.6% average rate over the last four quarters compared to a 10.5% pace for other counties. Apartment construction increased in second-home markets by 11.1%.
“The HBGI clearly shows that the geographic changes noted in the second quarter data continued into the fall, providing a boost to building in more affordable markets,” said NAHB Chief Economist Robert Dietz. “The ability of individuals and families to live further from urban cores is empowering consumers to acquire housing with more space at a lower cost. A key question is how long this effect will last. Our forecast assumes at least a persistent, partial effect beyond the deployment of a vaccine.”
According to the report, apartment construction in large metro core and suburbs fell from 67.1% to 65.2% during Q3, while apartment construction in small metro core areas increased from 21% in Q1 to 22.4% in Q3.
Home Purchase Activity up 9% Despite a Slow Holiday Week*
There was the usual disruption to mortgage application activity during the Thanksgiving holiday week that ended November 27, although the volume, especially of purchase applications held up relatively well. The Mortgage Bankers Association (MBA) said its Market Composite Index, a measure of mortgage loan application volume, eased back by 0.6 percent on a seasonally adjusted basis from one week earlier and was down 32 percent absent adjustment. During Thanksgiving week in 2019 the adjusted Index fell by more than 9.2 percent.
The Refinance Index decreased 5 percent from the previous week but was 102 percent higher than the same week one year ago. The refinance share of mortgage activity decreased to 69.5 percent of total applications from 71.1 percent the previous week.
The seasonally adjusted Purchase Index increased 9 percent from one week earlier but was down by 28 percent on an unadjusted basis. Activity was 28 percent higher than the same week one year ago.
Residential Sector Was Key to October Construction Spending Increase*
Total construction spending in October was at a seasonally adjusted annual rate of $1.439 trillion according to U.S. Census Bureau estimates. This was an increase of 1.3 percent from the revised September estimate of $1.420 trillion and 3.7 percent higher than spending in October of 2019. While virtually all residential spending is privately funded, the increase in that sector was the second largest (behind public safety spending) of any in the overall year-over-year comparison.
Spending for the month, prior to adjustment, totaled $128.008 billion compared to $130.251 billion in September. Spending for the year-to-date (YTD) is up 4.3 percent, from $1.140 trillion in 2019 to $1.190 during the first 10 months of 2020.
Privately funded construction spending was at an annual rate of $1.094 trillion during the month compared to $1.079 trillion in September, an increase of 1.4 percent. Spending grew by 3.7 percent on a year-over-year basis and is 4.2 percent higher on a YTD basis at $893.706 billion.
MBS Day Ahead: The Absolutely Ridiculous State of Mortgage Rates vs MBS vs Treasuries*
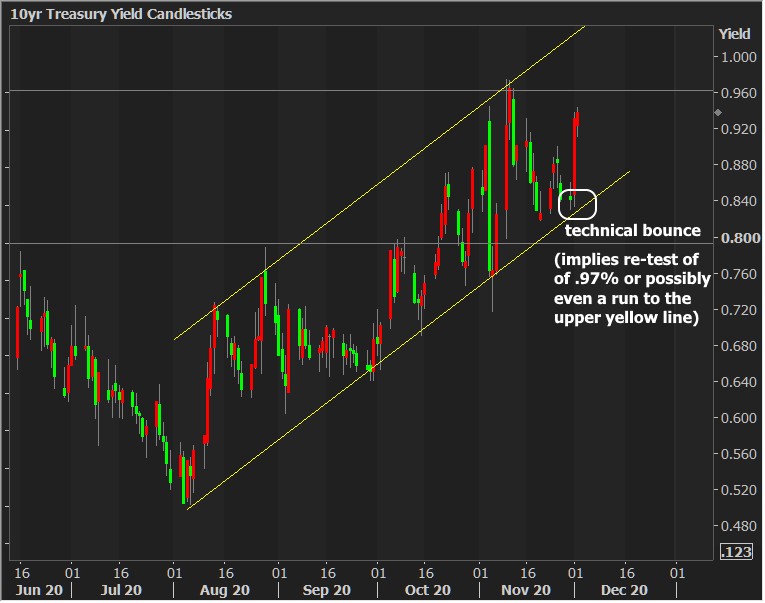
Following yesterday’s sharp losses, the bond market didn’t do much overnight, nor is it doing much to push back in the other direction this morning. In fact, 10yr yields are starting out at their highest levels since the Pfizer vaccine sell-off in early November, and those were the highest levels since March. Moreover, the weakness made for a perfect technical bounce on the lower line of the trend channel we’ve been tracking. From a purely technical perspective, the implication is to once again challenge (or “re-test”) the recent highs, at a minimum. We’re close enough to those to consider that a work in progress, actually. The scarier scenario would be a move to the upper trend line.
In thinking about scary scenarios, it’s definitely one of those precious few historical moments where we absolutely have to differentiate between MBS and Treasuries (99% of the time, this only matters on an intraday basis). Fortunately, MBS are nowhere near their November lows (remember, higher = better in the following chart, because it’s in PRICE as opposed to YIELD).
The downside of the hot 2020 housing market: rapid home-price growth*
With artificially low mortgage rates, there’s nothing to restrain demand
Demand for housing was strong in early 2020, before the COVID-19 crisis hit. Mandated shut-down measures and the fear of what COVID would do to our economy temporarily immobilized the housing market, evinced by nine weeks of declines in the weekly purchase applications data on a year-over-year basis. Then it was as if the Housing Demographic God exerted her chronokinetic powers to snap demand back to pre-COVID levels of growth. The frozen market thawed and resumed its steady pace of growth, even making up for lost time.
Instead of a housing crash, as many others predicted would be the lasting consequence of shut-down policies and massive job losses across the nation, the opposite happened as the 2020 U.S. housing market has been the most out-performing economic sector in the world.
However, we now have another issue to worry about — that home prices will accelerate too quickly, unrestrained by an increase in mortgage rates. As you can see below, we have deviated from the normal price growth that had been the trend in recent years.
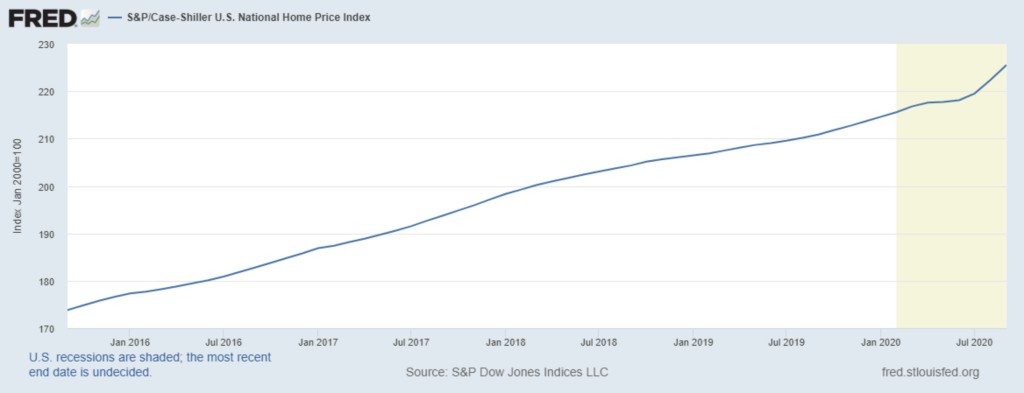
My biggest fear for the housing market in years 2020-2024 was never a lack of demand, as the housing bubble boys have been trolling about the last eight years — it was an unhealthy rate of price growth due to demographics and low mortgage rates.
When demographics are good for housing, meaning we have a large number of our populace at home-buying age, demand — and thus home prices — can be moderated by higher interest rates. We were witness to this in 2018 when mortgage rates increased to 4.75%-5%, demand fell and the rate of growth of real home prices went negative, year over year.
That was then and we can clearly see this isn’t the case anymore.
Finding highly affordable leads to keep sales coming in
At iLeads, we have many great solutions for mortgage LO’s at a low cost. If you’d like to see how we can help you bring in consistent sales for a great price, give us a call at (877) 245-3237!
We’re free and are taking phone-calls from 7AM to 5PM PST, Monday through Friday.
You can also schedule a call here.